Lakehouse → Analytics Marts on Amazon Redshift

AWS • Analytics • Advanced • Healthcare

Architecture Diagram

Overview

In the previous pipeline, healthcare data was shaped into Gold tables that are easier to use for analytics and reporting.

But business teams usually do not consume raw Gold tables directly. They need reporting-ready datasets that answer specific questions for operations, clinical quality, finance, and leadership teams.

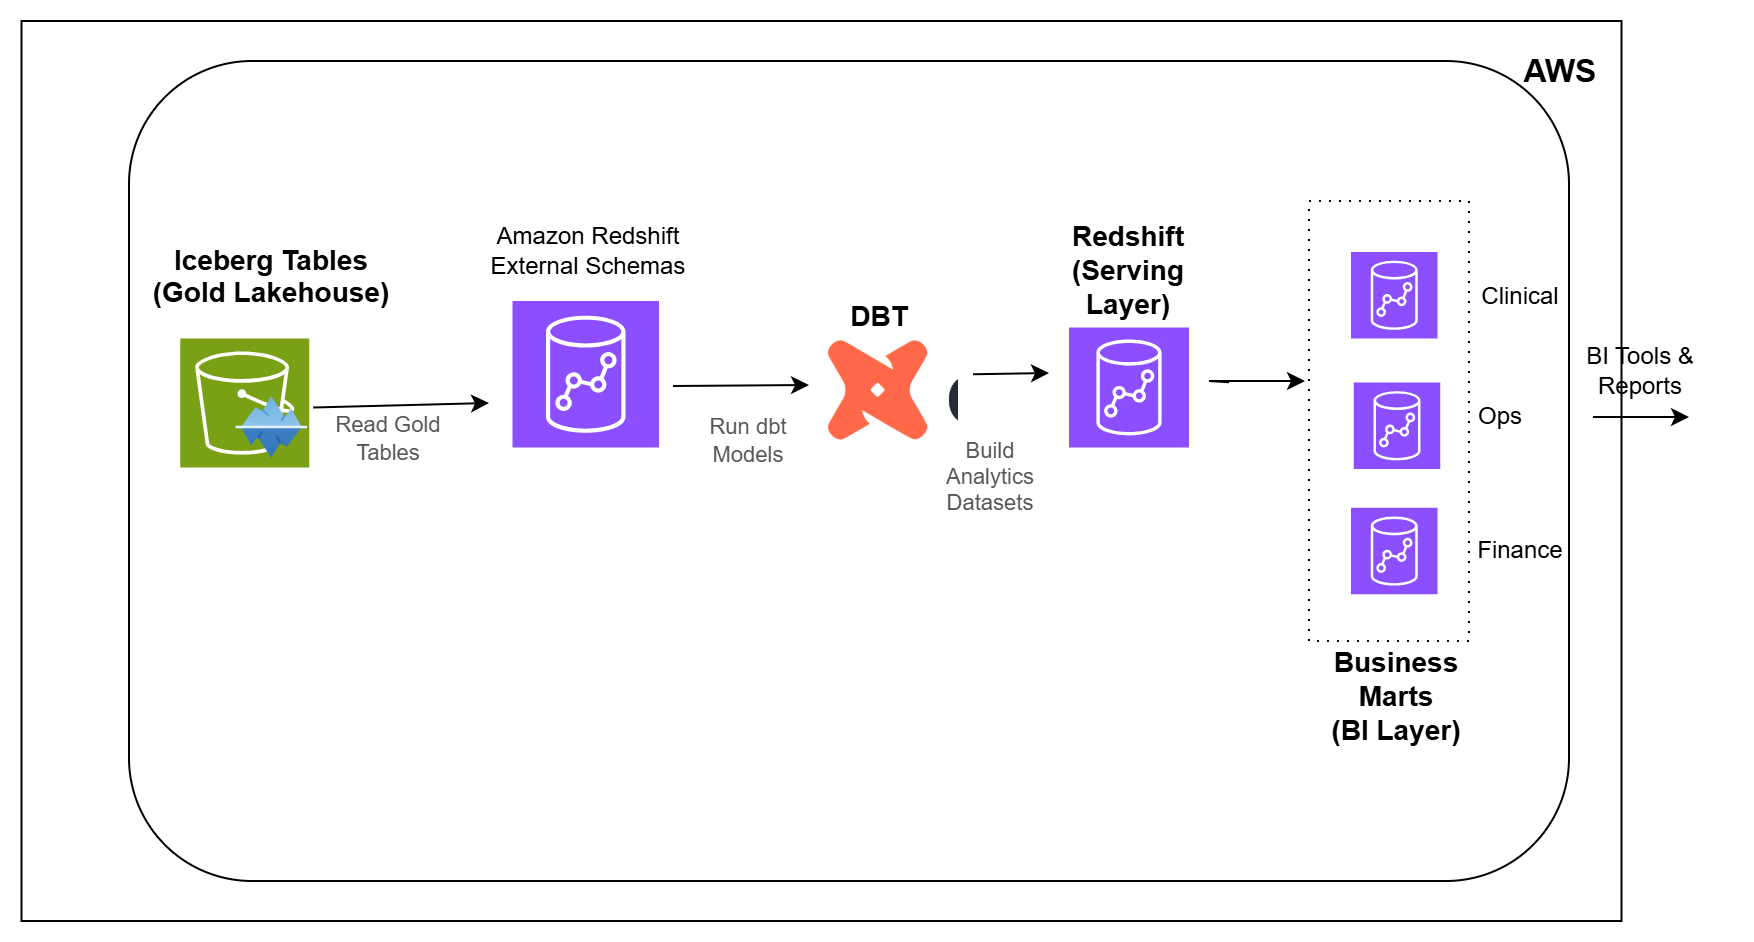
In this pipeline, you will build the analytics layer.

You will connect Amazon Redshift to the lakehouse, transform the data using dbt, and create datasets that can be used for dashboards, analytics, and decision-making.

What You Will Build

  • Connect Amazon Redshift to Gold lakehouse tables
  • Create external schemas backed by AWS Glue Catalog
  • Set up dbt for analytics engineering
  • Build staging and serving layer models
  • Create Operations reporting marts
  • Create Clinical Quality reporting marts
  • Create Revenue and Finance reporting marts
  • Create Executive scorecards
  • Build audit and data freshness monitoring models
  • Run analytics transformations using dbt

Tech Stack

Amazon Redshift Serverless • DBT • Amazon S3 • Apache Iceberg • AWS Glue Catalog • SQL • Redshift External Schemas

Learning Outcomes

After completing this pipeline, you will be able to:

  1. Connect Amazon Redshift to lakehouse tables on Amazon S3
  2. Build analytics transformations using dbt
  3. Create reporting-ready datasets for business teams
  4. Design analytics models for operations, clinical quality, finance, and executive reporting
  5. Organize dbt models into staging, serving, BI, and audit layers
  6. Monitor data freshness and row count differences
  7. Understand how lakehouse data is served to analytics teams